
- Article
- Apr 1, 2026
What's New in NVEIL: Dashboards, Timeline, Choregraph and more !
Multi-chart dashboards, choropleth maps, temporal timelines and Choregraph pipelines: what's new in NVEIL's no-code data visualization platform.
Read article ⟶
- Article
- Mar 31, 2026
Benford's Law: The Mathematical Fingerprint Hidden in Every Dataset
In natural data, the digit 1 appears first 30% of the time. Learn how data scientists use Benford's Law to detect financial fraud and test data quality.
Read article ⟶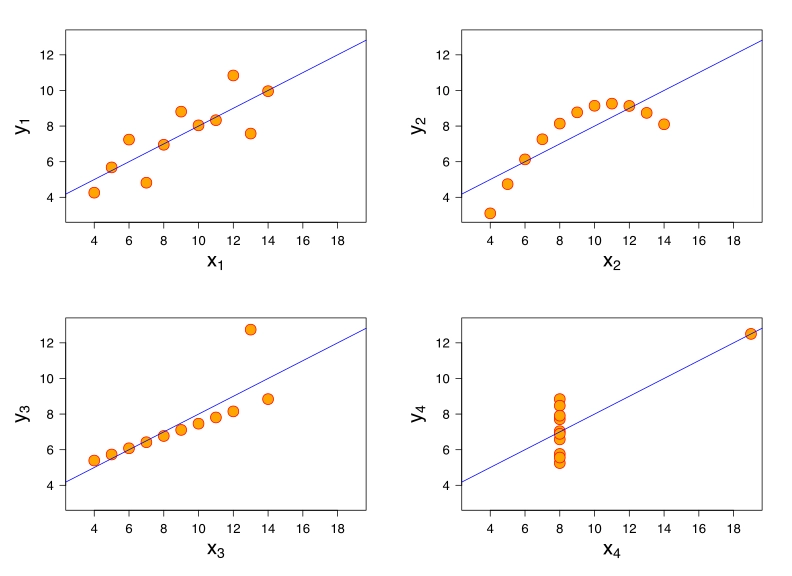
- Article
- Mar 31, 2026
Anscombe's Quartet: The Four Datasets That Proved Statistics Can Lie
Four datasets, identical statistics. Four different shapes. Anscombe's 1973 proof that visualization is a scientific necessity, not a presentation tool.
Read article ⟶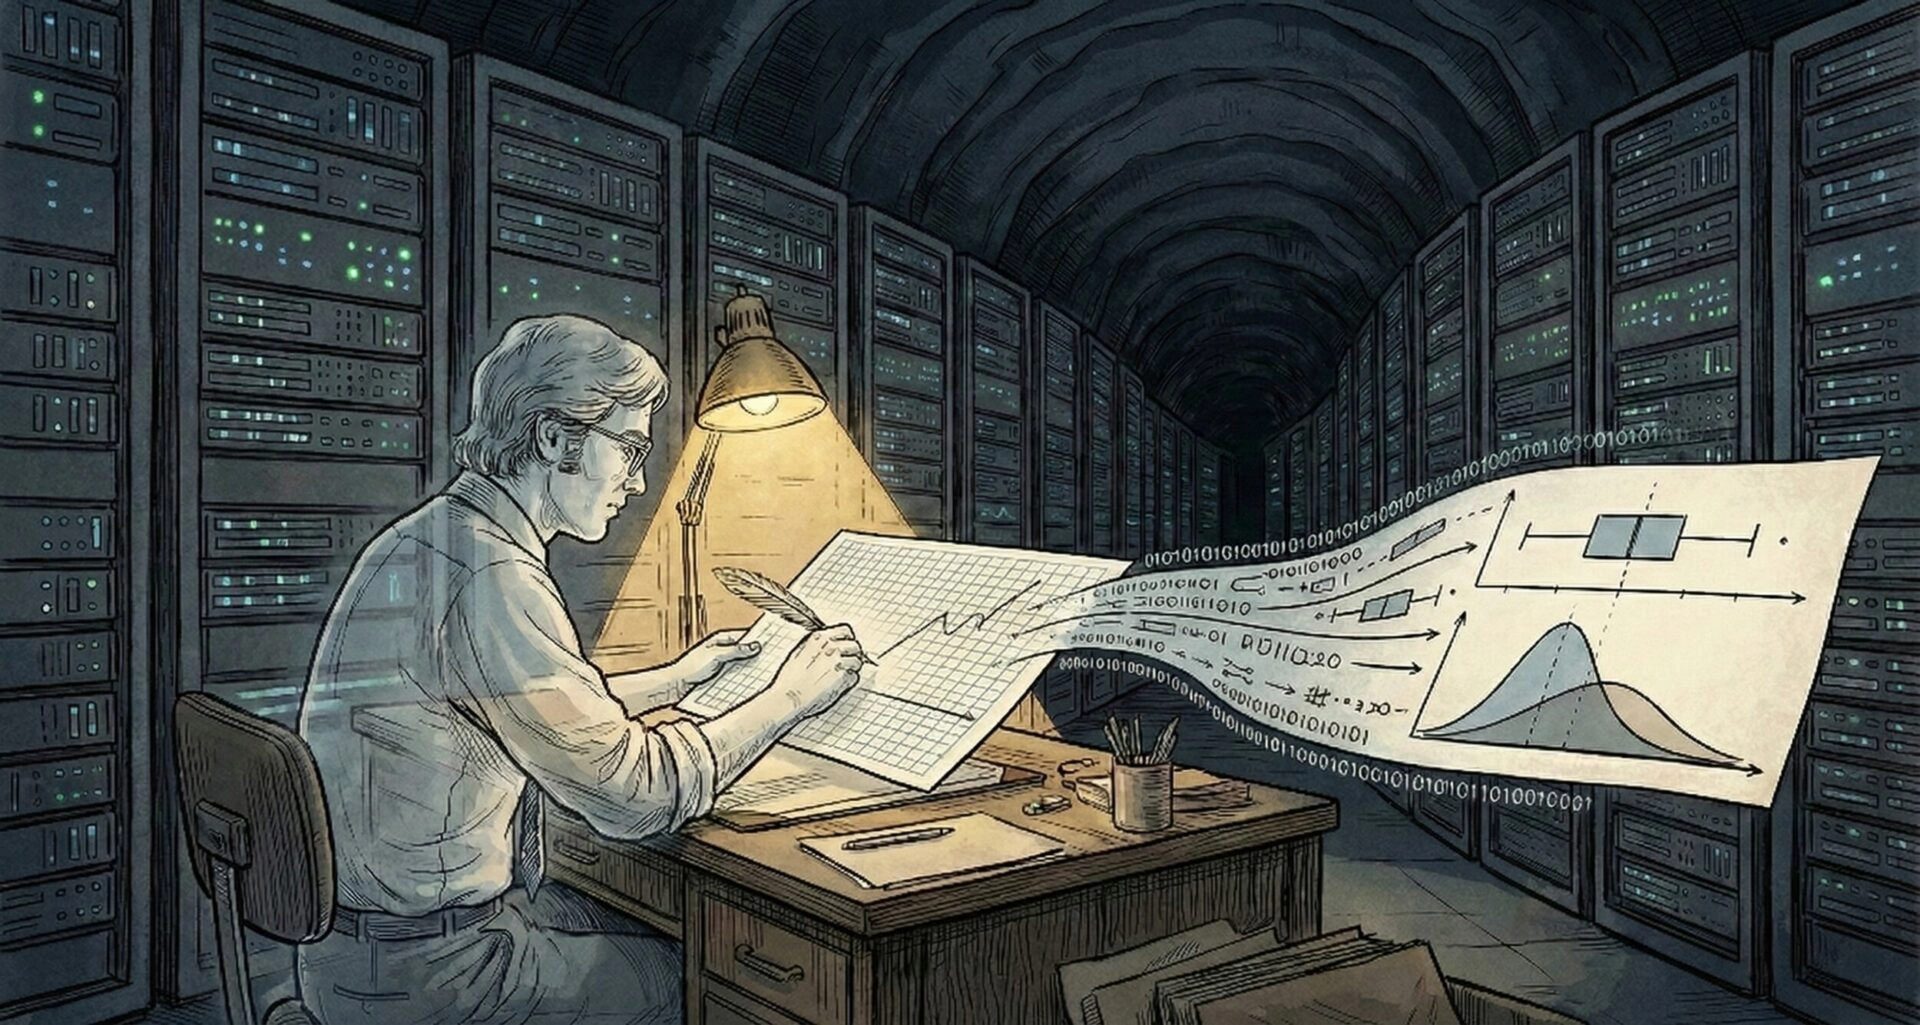
- Article
- Mar 31, 2026
Blinded by Scale: The Problem of Computational Abundance in the age of Black Box algorithms
We process petabytes yet see nothing. How the Black Box Rush blinds data science — and why Tukey's Exploratory Data Analysis still matters today.
Read article ⟶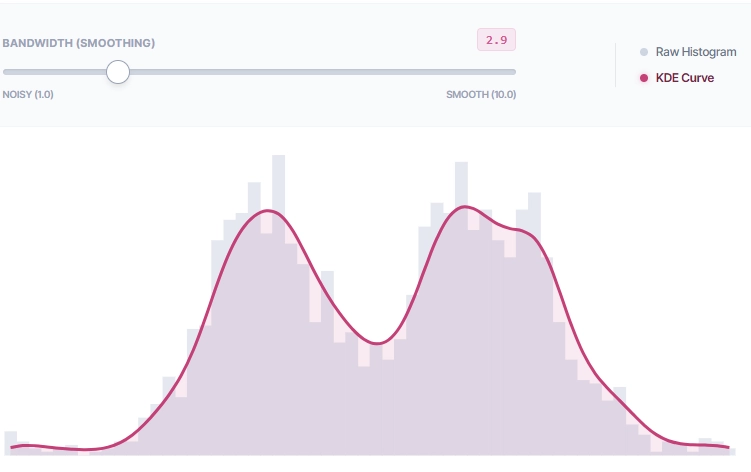
- Article
- Mar 31, 2026
The Histogram: From Pearson’s Evolution to Modern Density
Karl Pearson invented the histogram in 1895, but binning bias can silently distort your analysis. Learn when Kernel Density Estimation reveals the truth.
Read article ⟶
- 19 DEC. 2025 Online
Making the Invisible Visible: Welcome to the NVEIL Beta
Join the NVEIL beta — the AI data visualization platform that turns complex datasets into interactive 3D charts and maps instantly. No code, no setup.
Learn more ⟶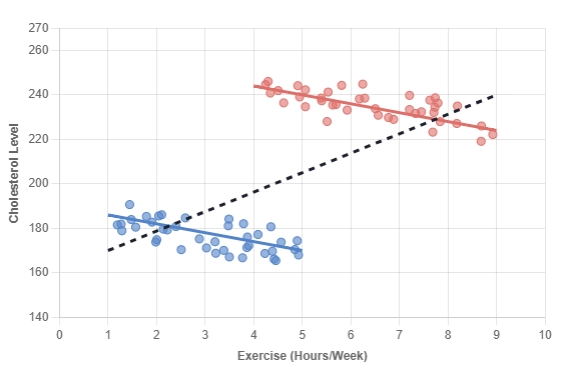
- Article
- Dec 19, 2025
Simpson's Paradox : When Aggregate Data Contradicts Subgroup Trends
Aggregating data can flip a trend entirely. Explore Simpson's Paradox through the Berkeley gender bias case and the kidney stone study.
Read article ⟶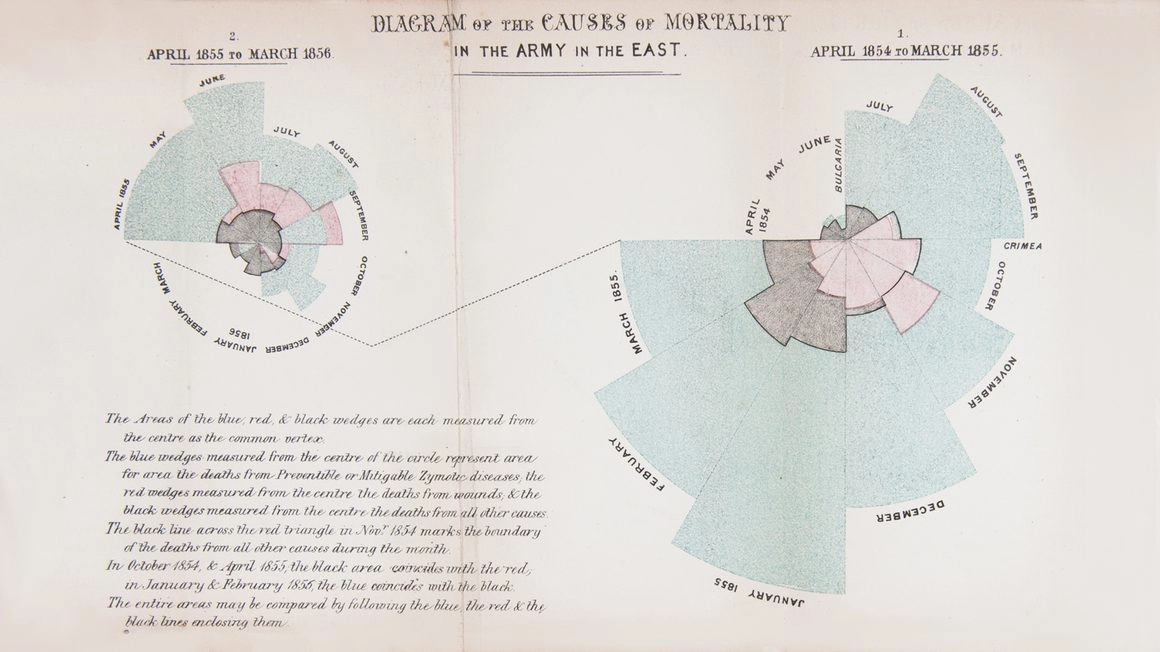
- Article
- Jan 5, 2026
The Lady with the Data: How Florence Nightingale Invented Modern Visualization
Florence Nightingale saved lives with data, not just a lamp. Discover her Rose Diagram and how she pioneered modern data visualization in 1854.
Read article ⟶

- 15 AND 16 OCT. 2024 Paris, France
Join us at the 13th edition of the Big Data & AI Expo!
Learn more ⟶
- Article
- Dec 19, 2025
What is data visualization ?
Data visualization transforms complex datasets into accessible insights, enhancing understanding and decision-making across various fields.
Read article ⟶